eBPF for Linux Admins: Part VI

Table of Contents
eBPF - This article is part of a series.
In previous chapters, we have seen how XDP and eBPF were used to filter packets.
Now we will see what is syscall, how we can use kprobes to trace a syscall etc.
Yes, from this chapter onwards, we are not dealing with network. I’ve started with network stack so that as a Linux admin you can easily connect the concepts of eBPF.
Hmm.. syscall? The kprobes,syscall,routine,breakpoints etc. are like alien language to me Don’t worry, it was same for me too, but we will cover the fundamentals of syscall before we move on to kprobes
As a Linux admin, you should know syscall and if not, then this article is for you.
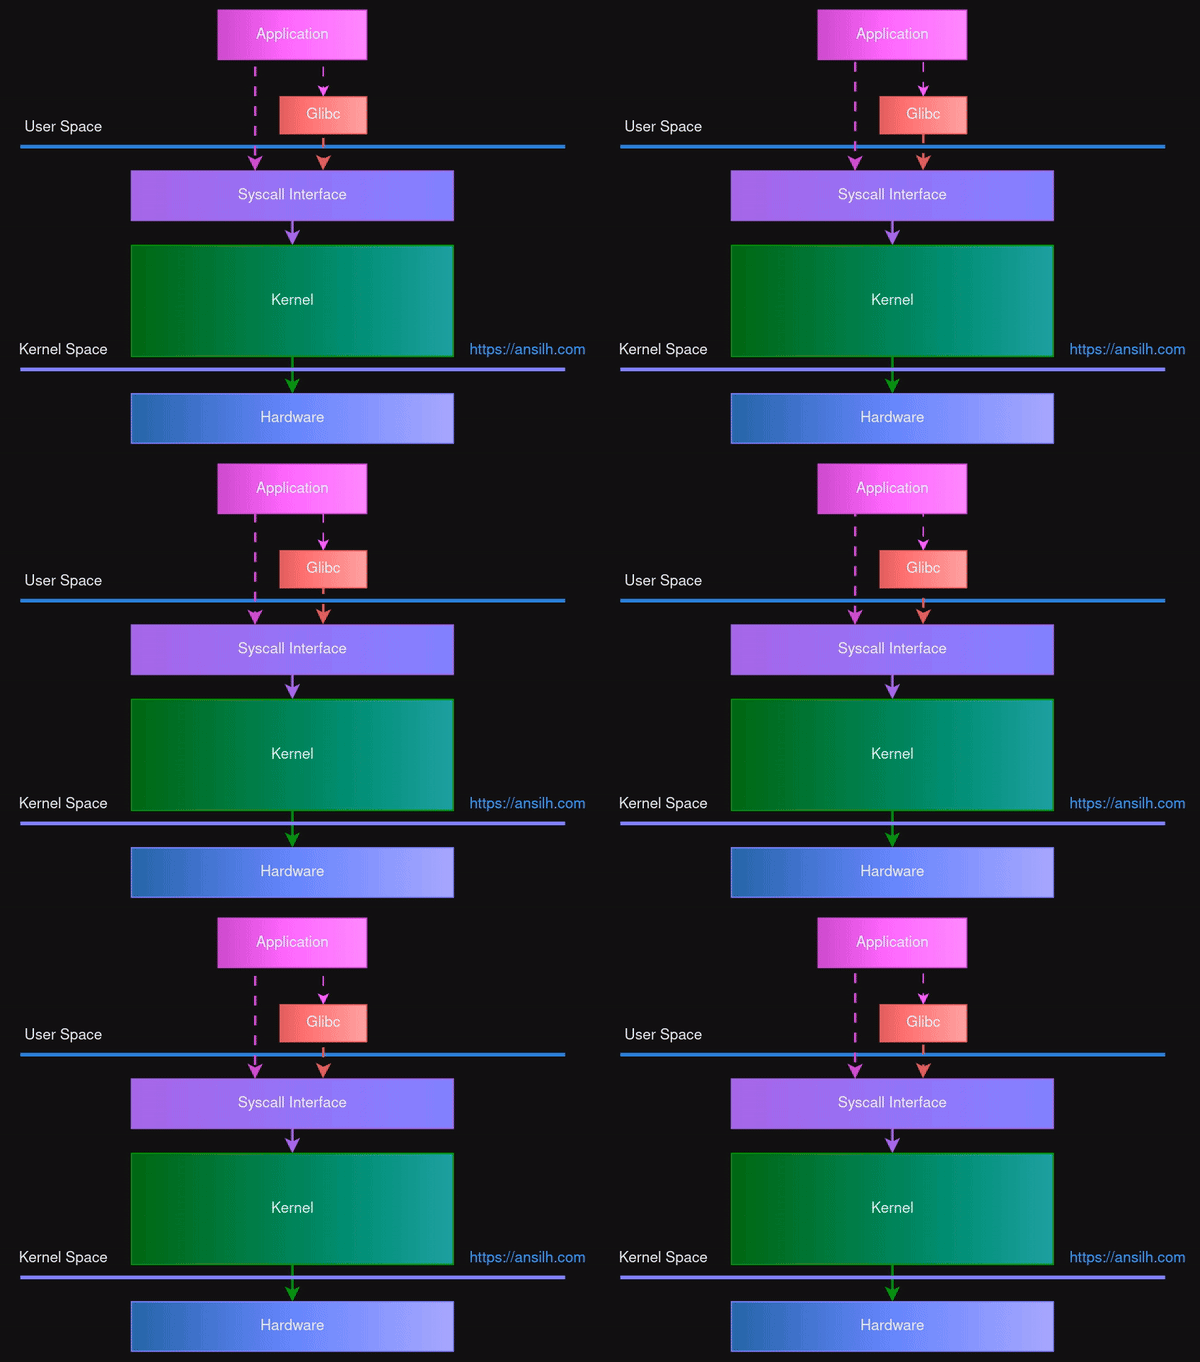
Below diagram shows how an application interact with the system.
The entrypoint for an application to the kernel space is the syscall interface.
You can use the strace command to see the syscalls made by a process.
Use below command to install strace if it’s not installed
sudo apt-get install strace
The below strace command shows the syscall (last column) made by the echo command.
ansil@ebpf:~$ strace -c echo Hello
Hello
% time     seconds  usecs/call     calls    errors syscall
------ ----------- ----------- --------- --------- ----------------
  0.00    0.000000           0         1           read
  0.00    0.000000           0         1           write
  0.00    0.000000           0        18           close
  0.00    0.000000           0        21           mmap
  0.00    0.000000           0         3           mprotect
  0.00    0.000000           0         1           munmap
  0.00    0.000000           0         3           brk
  0.00    0.000000           0         2           pread64
  0.00    0.000000           0         1         1 access
  0.00    0.000000           0         1           execve
  0.00    0.000000           0         2         1 arch_prctl
  0.00    0.000000           0         1           futex
  0.00    0.000000           0         1           set_tid_address
  0.00    0.000000           0        30        14 openat
  0.00    0.000000           0        17           newfstatat
  0.00    0.000000           0         1           set_robust_list
  0.00    0.000000           0         1           prlimit64
  0.00    0.000000           0         1           getrandom
  0.00    0.000000           0         1           rseq
------ ----------- ----------- --------- --------- ----------------
100.00    0.000000           0       107        16 total
ansil@ebpf:~$
Sample Write#
To further understand the syscall, let’s write a simple C program that will write a line to a file.
vi sample_write.c
#include <stdio.h>
#include <errno.h>
#include <string.h>

int main (void)
{
  FILE *fp = fopen ("./sample.txt", "w");
  if (fp != NULL)
    {
      if (fprintf (fp, "Random text\n") < 0)
	{
	  fprintf (stderr, "err=%d: %s\n", errno, strerror (errno));
	  fclose (fp);
	  return errno;
	}
      fclose (fp);
    }
  return 0;
}
Compile the program.
gcc sample_write.c -o sample_write
You can execute it and see examine the file content.
ansil@ebpf:~$ ./sample
ansil@ebpf:~$ cat sample.txt
Random text
ansil@ebpf:~$
From the user’s perspective, the program and the outcomes looks simple, but from a kernel point of view, there is a lot of things in play.
As a user, you are creating a file on the disk. The transactions goes through different layers like, the standard library, syscall, virtual file system, the file system driver, the disk driver and finally the disk.
The complexity of those interactions were abstracted away for the user by the kernel using syscall interface.
As an user, your application will be interacting with the syscall interface and everything else is taken care by the kernel.
Now, let’s see how many syscalls were made by our program.
ansil@ebpf:~$ strace -c ./sample_write
% time     seconds  usecs/call     calls    errors syscall
------ ----------- ----------- --------- --------- ----------------
 33.54    0.000912         912         1           execve
 13.90    0.000378          47         8           mmap
  9.64    0.000262          87         3           close
  8.16    0.000222          74         3           openat
  6.84    0.000186          62         3           mprotect
  6.36    0.000173         173         1           munmap
  4.30    0.000117          39         3           newfstatat
  4.05    0.000110          55         2           pread64
  3.38    0.000092          30         3           brk
  2.43    0.000066          66         1           write
  1.62    0.000044          22         2         1 arch_prctl
  1.10    0.000030          30         1         1 access
  0.96    0.000026          26         1           getrandom
  0.88    0.000024          24         1           read
  0.85    0.000023          23         1           prlimit64
  0.70    0.000019          19         1           set_robust_list
  0.66    0.000018          18         1           set_tid_address
  0.63    0.000017          17         1           rseq
------ ----------- ----------- --------- --------- ----------------
100.00    0.002719          73        37         2 total
ansil@ebpf:~$
You can even examine individual calls too.
Here I’m interested in openat syscall.
ansil@ebpf:~$ strace -e openat ./sample_write
openat(AT_FDCWD, "/etc/ld.so.cache", O_RDONLY|O_CLOEXEC) = 3
openat(AT_FDCWD, "/lib/x86_64-linux-gnu/libc.so.6", O_RDONLY|O_CLOEXEC) = 3
openat(AT_FDCWD, "./sample.txt", O_WRONLY|O_CREAT|O_TRUNC, 0666) = 3
+++ exited with 0 +++
There are 3 openat syscalls, two for loading libraries and the final one for opening our text file sample.txt.
We can clearly see the syscall made by our program to read the file in the output.
Now you know what is syscall and how to trace a program.
Let’s take a scenario where you want to see the openat syscall happening in the system without strace and without even interacting with the program 🤯
In next chapter, we will discuss how to do it using dynamic tracing with kprobes.
Please re-visit if you want to brush up the kernel module concepts.
